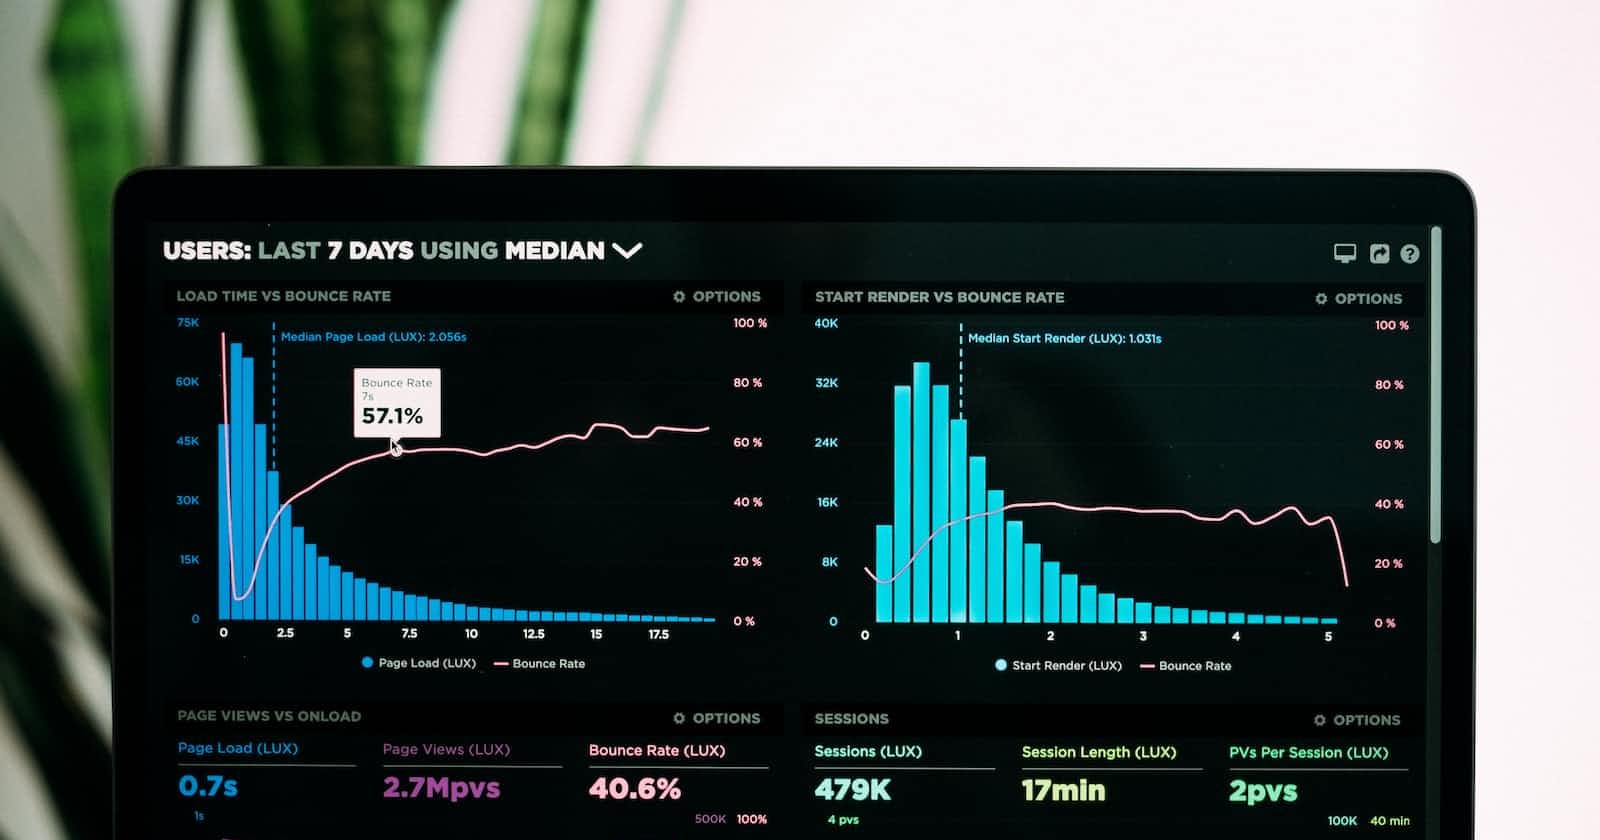
Data analytics is the process of examining, cleaning, transforming, and modeling data with the goal of discovering useful information, informing conclusions, and supporting decision-making. With the increasing amount of data being generated every day, data analytics has become a critical tool for organizations across various industries.
The Importance of Data Analytics
Data analytics is essential for organizations because it provides valuable insights into customer behavior, market trends, and internal processes. With the help of data analytics, organizations can make informed decisions, improve their operations, and drive growth.
Data analytics can help organizations in many ways, including:
Improving customer satisfaction by better understanding their needs and preferences Optimizing business processes to reduce costs and increase efficiency Identifying new business opportunities and growth areas Monitoring and improving the performance of marketing campaigns Predictive modeling for forecasting future trends and identifying potential risks
The Process of Data Analytics
Data analytics is a multi-step process that includes the following steps:
Data Collection: The first step in data analytics is to collect data from various sources such as databases, spreadsheets, and APIs.
Data Cleaning: The collected data is often dirty, which means it contains errors, duplicates, and irrelevant information. Data cleaning is the process of removing these inconsistencies and making the data usable.
Data Exploration: Once the data has been cleaned, it is time to explore it to gain an understanding of the data's structure, patterns, and relationships. This step is crucial for identifying the most relevant data for the analysis.
Data Transformation: Data transformation is the process of converting the data into a format that is suitable for analysis. This may involve aggregating data, normalizing data, or creating new variables.
Data Modeling: Data modeling is the process of creating models to explain the relationships between variables in the data. This step involves using statistical techniques and algorithms to identify patterns in the data.
Data Visualization: Data visualization is the process of presenting the data in a graphical format to make it easier to understand and interpret. This step is crucial for communicating the insights generated from the analysis.
Data Analytics Tools
There are many data analytics tools available that can help organizations of all sizes to perform data analytics. Some of the most popular data analytics tools include:
R: An open-source programming language for statistical computing and graphics.
Python: A general-purpose programming language with a strong emphasis on data analysis and visualization.
SQL: A programming language used to manage and manipulate data stored in relational databases.
Tableau: A data visualization tool that helps organizations to explore and present their data in a graphical format.
Power BI: A business intelligence and data visualization tool that provides insights into business data.
In conclusion, data analytics is an essential tool for organizations that want to stay ahead of the competition. With the right tools and techniques, organizations can unlock the power of their data to make informed decisions, drive growth, and improve their operations.

